-

Functions
App provide unique help with live training
For now, it works with just ANT+ devices. Visible devices can be named and saved for future use, so theres not neccessary to search unknown devices and remember their ID.
Higly customizable graph solution, but extremely easy to use. All values are shown on one Y axis, with custom measure. For example, if there are Y axis size 500 points (default value), heart rate should be between 0 and 200, power should be between 250 and 500. With this setting, curves will never be crossed. But there are also option to cross curves, with different settings. Heart rate between 0 and 500 and power on the same points is also possible.
These settings are also good for muttiple sensors and/or multiple users. There should be two heart rate curves or two power curves.
Main goal of Aurelius is live controlled training with Smo2 sensors. Moxy devices gives two curves, ThB and Smo2. If Moxy are connected, you can show also curves with O2Hb and HHb. For this I suggest to use Aurelius with less other sensors.
On live training you can set lenght of X axis, default value is 60 seconds, but depends on type of intervals which lenght is needed. Can be set directly on graph.
Additional values, likes frequency and expected values from sensors can be pretty useful. For power intervals you can set it from 100W to 2000W, for longer intervals is usefull to have top value much lower.
-
Screens 1/6
Main page with one sensor
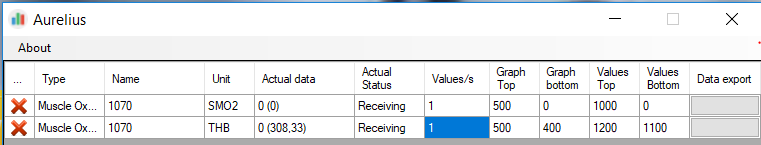
Main page. One Moxy device was founded, Smo2 and Thb values. With "Values/s" frequency can be set. Graph top and bottom values set space, where will be curve of these values. With this setting will be curve of Thb relatively flatter than Smo2, due to space (500 points and 100 points). If you want o see more detailed Thb, it can be set on wider range. Values top and bottom are fields for expected values. Smo2 is percentage (1000 - 0), but expected values of Thb makes graph much better.
All data visible in graph are calculated to one Y axis. In "actual data" field is really measured data and calculated value, which depend on graph and expected values for given sensor. Thanks to this can be visible power with range 0-2000W, heart rate with 60-220, cadence 0-150 etc. on one single graph.
NextNext -
Screens 2/6
Heart rate graph, focused on values 80-100.

On homepage we can set expected values, 220 and 100 for example. But during some kind of training you can focus on some data. Now, when heart rate is low, we can set size at bottom left to show just everything between 80 and 100. Lenght is now set to one minute, real time value is 87 (bottom right).
NextNext -
Screens 3/6
Two users with heart rate and cadence
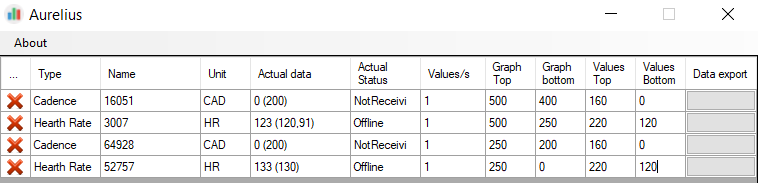
Two users on one graph. Top half will be set for first one, bottom then to second one. Half of graph will be for heart rate, and just 100 points for cadence. In this training we are higly focused on heart rate curve and additional information is cadence.
NextNext -
-
Screens 5/6
Video
As you can see, smo2 can be set to show only values lower than 50% / this can be usefull for pretty hard intervals :)
Next videoNext video -
-
contact information
Pre sale alpha version
Currently can be ordered via email - testing, fully functioned alpha version. Future development, new functions and all these stuff depends also on reports and feedback.
If you are interested, make an offer I can't refuse :D
I hope that development wont be just on my wallet :)Marek Mixa
Petříkov, Czech republic
Freephone: + 420 724 116 963
E-mail: mixa@kovopraha.cz